
INVESTOR RELATIONS
Market Overview
Office Building
Stock Data
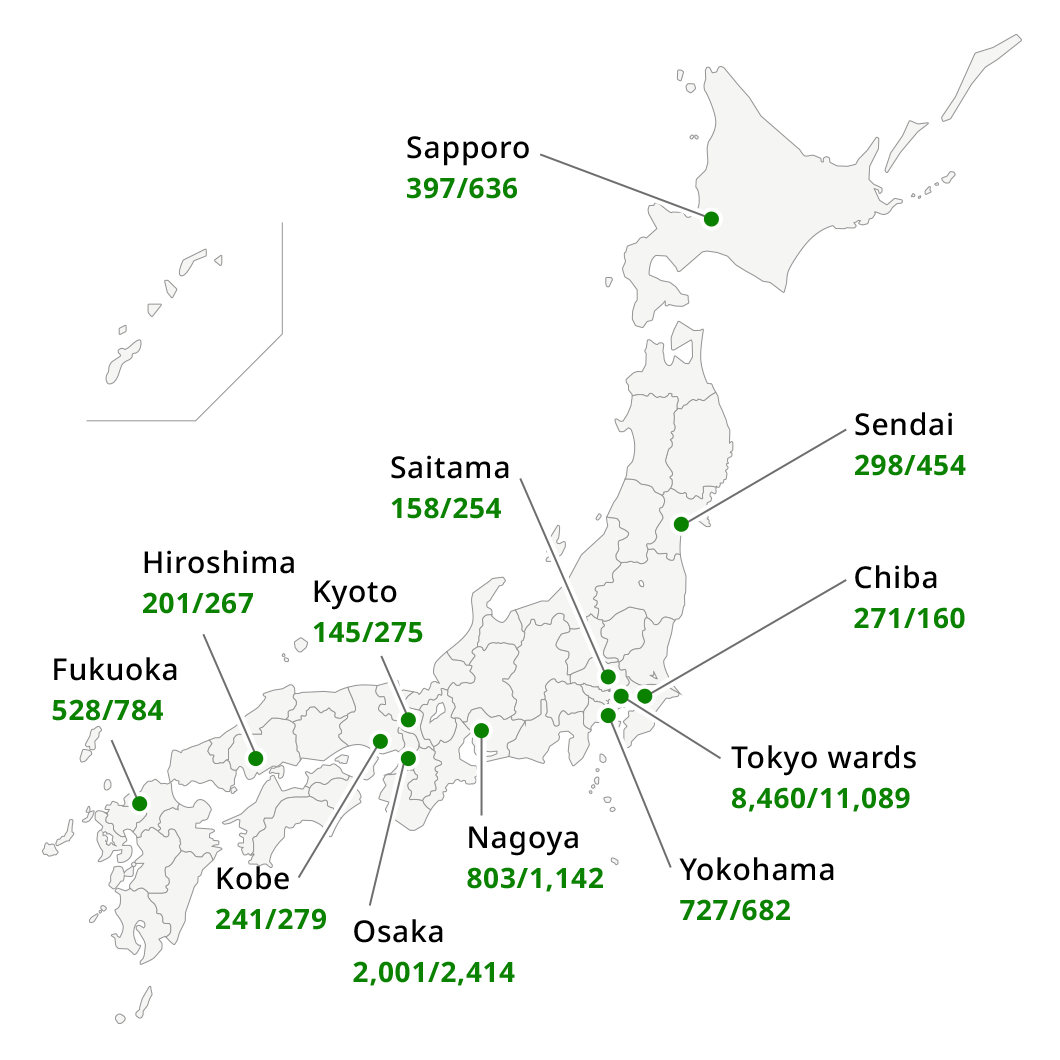
Overview of Office Buildings as of January 2025
| Stock | |||
|---|---|---|---|
| 10,000 sq m | No. | ||
| 3 Major Areas | Tokyo | 8,504 | 11,289 |
| Osaka | 2,097 | 2,497 | |
| Nagoya | 808 | 1,126 | |
| Sub total | 11,409 | 14,912 | |
| Major cities | Sapporo | 399 | 630 |
| Sendai | 291 | 437 | |
| Saitama | 154 | 249 | |
| Chiba | 267 | 157 | |
| Yokohama | 759 | 680 | |
| Kyoto | 140 | 270 | |
| Kobe | 241 | 281 | |
| Hiroshima | 202 | 261 | |
| Fukuoka | 528 | 779 | |
| Sub total | 2,980 | 3,744 | |
| Other than the areas above | 927 | 1,583 | |
| Total | 15,316 | 20,239 | |
Source:Japan Real Estate Institute Co. Ltd. "Japanese Office Buildings Survey"
Note:Sum of each item does not match total because the value of each item is rounded (the same applies to other tables)
Note:Next update scheduled: Around December 2026
Point
Office building stock is heavily concentrated in Japan's three major cities (Tokyo, Osaka, and Nagoya). Concentration is particularly heavy in central wards of Tokyo.
The Central Wards of Tokyo also stand out in terms of The Total Floor Area of Building Construction Started.
While vacancy rates in the central wards of Tokyo has been at a low level. Furthermore, there is a significant difference in rental rates between the central wards of Tokyo and other regions.
Office Buildings:Construction Starts in Floor Area
You can scroll this chart sideways
(ha)
(Year)
Source:Ministry of Land, Infrastructure, Transport and Tourism,"Annual Construction Statistics".
Note:Figures above are total floor area of SRC, RC and steel-frame for office.
Note:Next update scheduled:Around March 2027
Point
Office building stock is heavily concentrated in Japan's three major cities (Tokyo, Osaka, and Nagoya). Concentration is particularly heavy in central wards of Tokyo.
The Central Wards of Tokyo also stand out in terms of The Total Floor Area of Building Construction Started.
While vacancy rates in the central wards of Tokyo has been at a low level. Furthermore, there is a significant difference in rental rates between the central wards of Tokyo and other regions.
Office Building:Vacancy Rates and Rents
You can scroll this chart sideways
(Yen/Tsubo=3.3sq m)
(%)
(Year)
Source:Miki Shoji Co., Ltd.
Note:- Vacancy Rates:(Vacant area / total rent area), Every December for annual figure.
- Average Offered Rents:Rent in December each year
Note:Next update scheduled:Around March 2027
Point
Office building stock is heavily concentrated in Japan's three major cities (Tokyo, Osaka, and Nagoya). Concentration is particularly heavy in central wards of Tokyo.
The Central Wards of Tokyo also stand out in terms of The Total Floor Area of Building Construction Started.
While vacancy rates in the central wards of Tokyo has been at a low level. Furthermore, there is a significant difference in rental rates between the central wards of Tokyo and other regions.
Commerce
Distribution
Overview of Shopping Center 2025 (As of December 31, 2025)
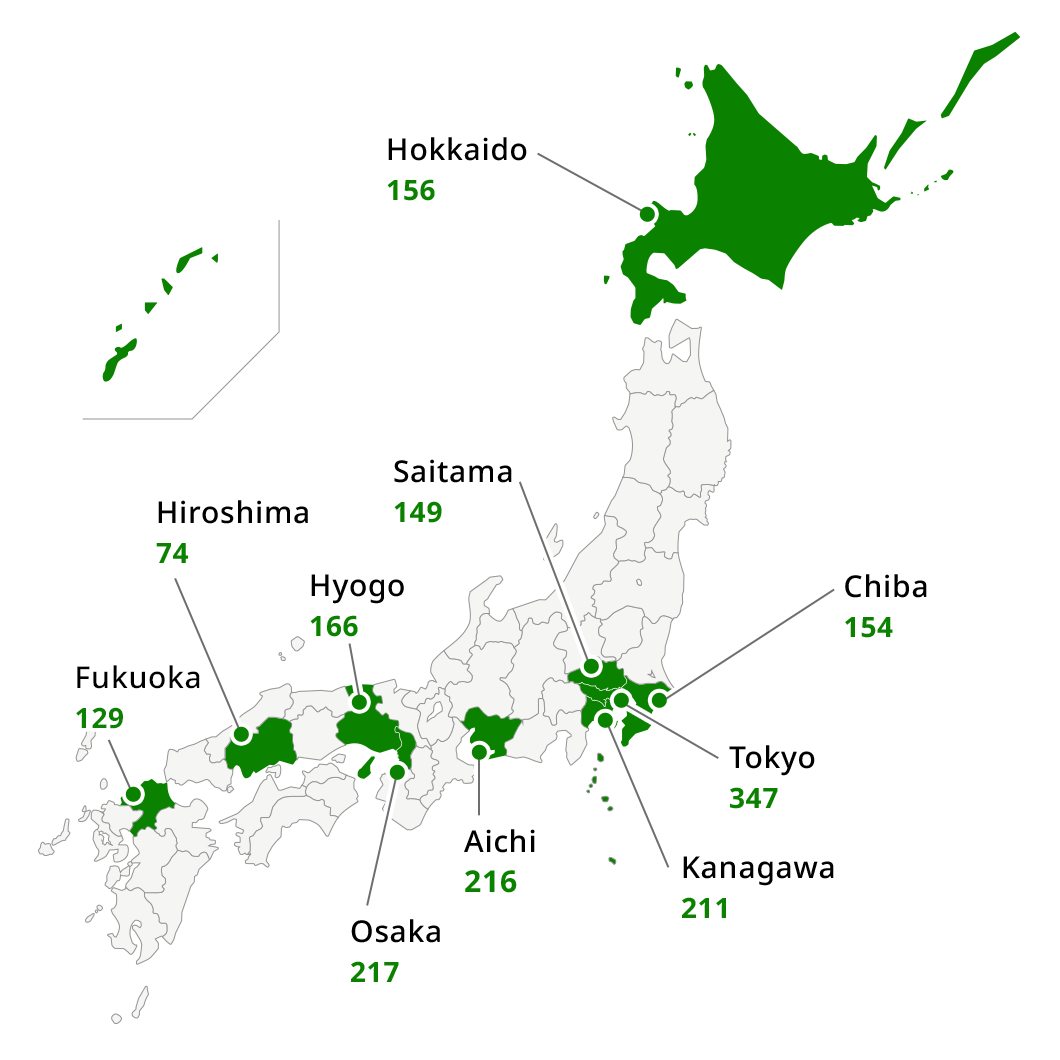
| Total Number of Shopping Center | 3,013 |
| Total Number of Tenants | 164,545 |
| Average Number of Tenants per Shopping Center | 55 |
| Total Retail Floor Space | 53,972,771m2 |
| Average Retail Floor Space per Shopping Center | 17,913m2 |
Source:Japan Council of Shopping Centers "Present Conditions of Japanese Shopping Centers"
Note:The number of shopping centers and total floor space are for shopping centers operating as of end December 2025.
Note:Next update scheduled:Around July 2027
Point
Excluding the large island of Hokkaido, the top10 in terms of shopping center numbers are regions where major cities are located.
Total floor area of construction started is sluggish reflecting slower nominal consumption expenditure.
Retail Facilities:Construction Starts in Floor Area and Retail Sales
You can scroll this chart sideways
(1,000sqm)
(%)
(Year)
Source:- Retail Sales:Ministry of Economy, Trade and Industry "Current Survey of Commerce".
- Nominal Personal Consumption:Ministry of Internal Affairs and Communications "Census on Households".
- Construction Starts for Retail Facilities in Floor Area:Ministry of Land, Infrastructure, Transport and Tourism "Building construction start statistics survey".
- Nominal Personal Consum:Variable adjustment values have been posted for 2018 and 2019
Note:Next update scheduled:Around March 2027
Point
Excluding the large island of Hokkaido, the top10 in terms of SC numbers are regions where major cities are located.
Total floor area of construction started is sluggish reflecting slower nominal consumption expenditure.
Retail Facilities:Sales by Sector
You can scroll this chart sideways
(billion yen)
(Year)
Source:The number of shopping center openings, sales:Japan Council of Shopping Centers "Present Conditions of Japanese Shopping Centers",
"Gross Sales"; Sales of department stores, super markets and convenience stores: Ministry of Economy, Trade and Industry "Current Survey of Commerce".
Note:Next update scheduled:Around March 2027
Point
Excluding the large island of Hokkaido, the top10 in terms of SC numbers are regions where major cities are located.
Total floor area of construction started is sluggish reflecting slower nominal consumption expenditure.
Condominium
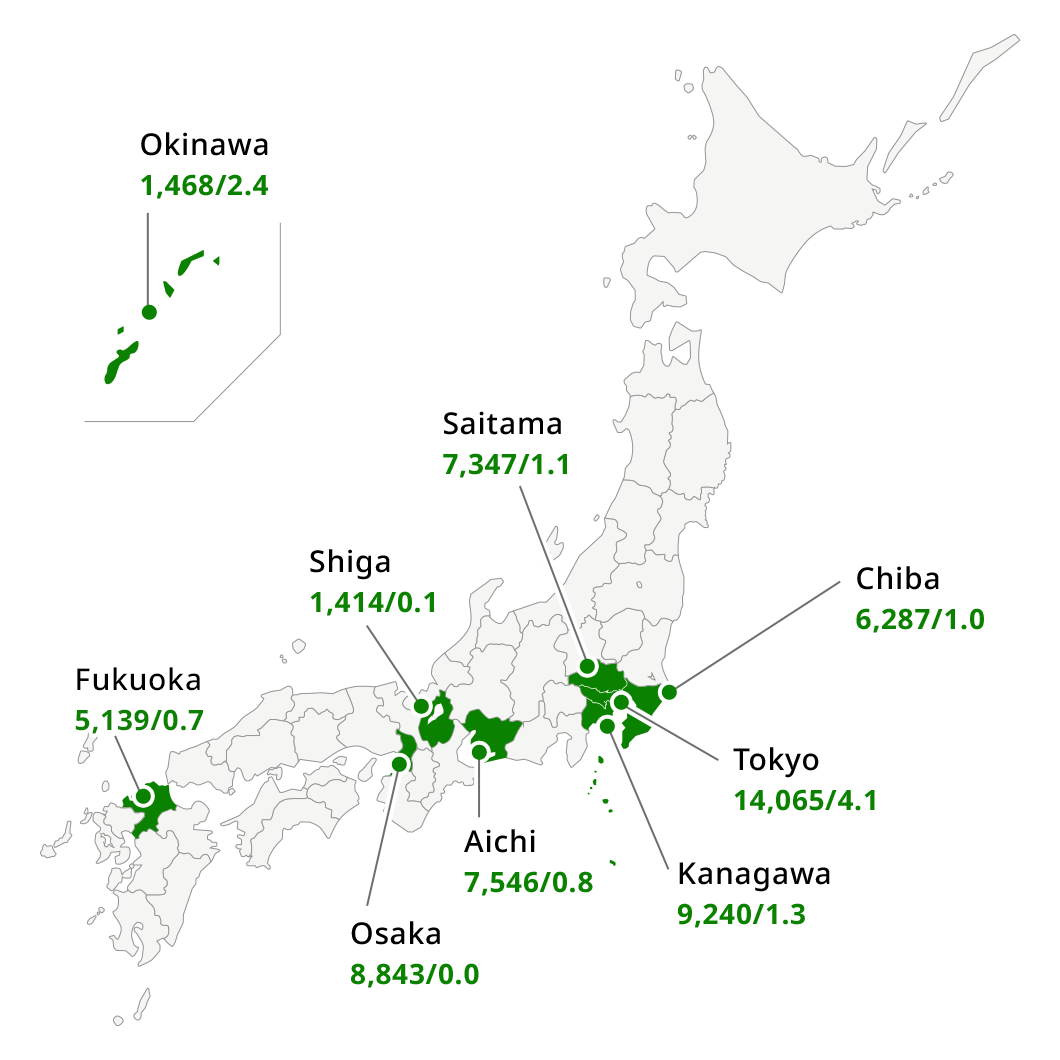
Population by Prefecture
Population of Japan 2020:126,227 thousands
| Pref. | 2015 | 2020 | Rate of population change (2015-2020) |
|---|---|---|---|
| Saitama | 7,267 | 7,347 | 1.1% |
| Chiba | 6,223 | 6,287 | 1.0% |
| Tokyo | 13,515 | 14,065 | 4.1% |
| Kanagawa | 9,126 | 9,240 | 1.3% |
| Aichi | 7,483 | 7,546 | 0.8% |
| Shiga | 1,413 | 1,414 | 0.1% |
| Osaka | 8,839 | 8,843 | 0.0% |
| Fukuoka | 5,102 | 5,139 | 0.7% |
| Okinawa | 1,434 | 1,468 | 2.4% |
Source:Statistical Survey Department, Statistics Bureau, Ministry of Internal Affairs and Communications "the Population Census and the Population Estimates"
Note:Next update scheduled:Autumn 2026 (Based on the Population Census every 5 years. Next census expected in 2025, survey results expected to be announced in 2026)
Point
Population trends in Japan indicate increasing urbanization. Population continues to rise in major cities.
Reflecting the inflow of population and shift of economic activity into the Tokyo metropolitan region the number of units sold is heavily concentrated in this region, and condominium prices in Tokyo metropolitan region are also much higher than in other regions.
The price of condominiums is on the rise, especially in the Tokyo metropolitan area, supported by steady demand.
Condominiums:Unit Sales
You can scroll this chart sideways
(condominium unit)
(%)
(Year)
Source:Real Estate Economic Institute Co., Ltd. "Condominium Market in Japan"
Note:Next update scheduled:Around March 2027
Point
Population trends in Japan indicate increasing urbanization. Population continues to rise in major cities.
Reflecting the inflow of population and shift of economic activity into the Tokyo metropolitan region the number of units sold is heavily concentrated in this region, and condominium prices in Tokyo metropolitan region are also much higher than in other regions.
The price of condominiums is on the rise, especially in the Tokyo metropolitan area, supported by steady demand.
Condominiums:Average Price per Unit
You can scroll this chart sideways
(million yen)
(%)
(Year)
Source:Real Estate Economic Institute Co., Ltd. "Condominium Market in Japan"
Note:Next update scheduled:Around March 2027
Point
Population trends in Japan indicate increasing urbanization. Population continues to rise in major cities.
Reflecting the inflow of population and shift of economic activity into the Tokyo metropolitan region the number of units sold is heavily concentrated in this region, and condominium prices in Tokyo metropolitan region are also much higher than in other regions.
The price of condominiums is on the rise, especially in the Tokyo metropolitan area, supported by steady demand.