BUSINESS INTRODUCTION
Tokyu Fudosan Holdings in Figures
Broad customer / market contact points
Group facilities under operation
Customers served
Approx.
Tenant companies (office)
552
Tenant companies (commercial)
1,267
Condominium units under comprehensive management
Approx.
832,000
Condominium management company (non-consolidated)
Condominium units under comprehensive management (approx. 470,000)
No.
2
in Japan
*2
Real estate transactions through agents
Approx.
33,000
Turnover through agents
Approx.
¥2.5
trillion
3
consecutive years as
No.1
*3
*1Including commercial facility cardholders and app members, BRANZ CLUB members, Tokyu Cosmos Members Club members, and Tokyu Harvest Club members
*2Source: Mansion Kanri Shimbun, May 25, 2026 issue
*3Based on the results of transaction surveys of major real estate agents selected by several industry publications, covering fiscal 2023 through fiscal 2025
Unique business creation ability
Renewable energy business
「ReENE」
As of June, 2026
Rated Capacity
2,082
MW
Total number of businesses
173
the Group's co-creation-based internal venture scheme
「STEP」
Launched in FY2019
Cumulative proposals received
530
Commercialized proposals
5
Corporate Venture Capital
Launched in FY2017
Cumulative investments
40
Group employees
(including temporary employees)
Approx.
Percentage reduction of Scope 1 and 2 CO2 emissions
(versus fiscal 2019)
-77.9
%
Degree of personal investment per operating officer at each Group company for achieving the long-term vision
90
%
Investment in digital transformation for creating new businesses
Since start of fiscal 2025
¥
25.1
billion
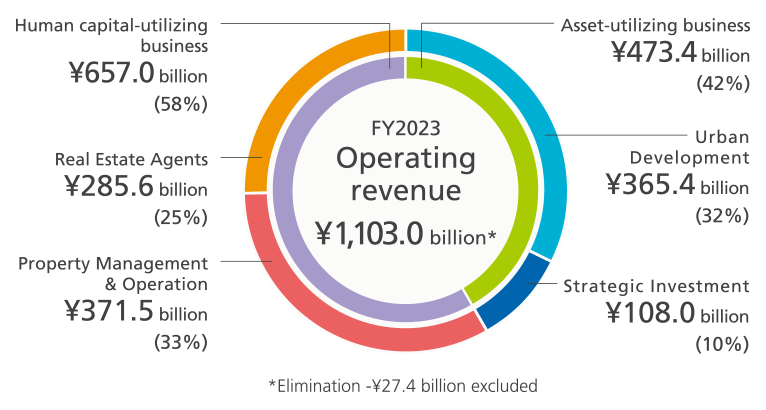
FY2025 Operating revenue composition ratio
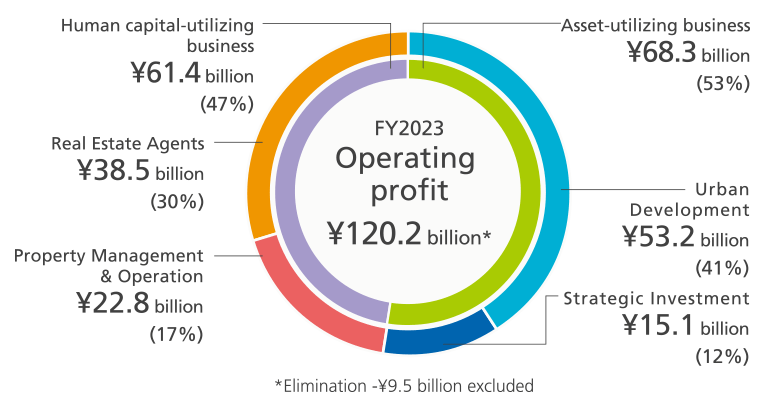
FY2025 Operating profit composition ratio
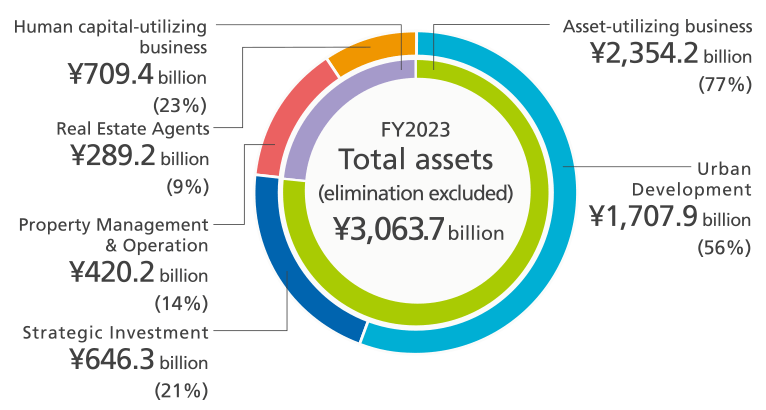
End of FY2025 Total assets ratio