
INVESTOR RELATIONS
Segment Infomation
Segment Infomation
[Accounting standards: Japanese GAAP]
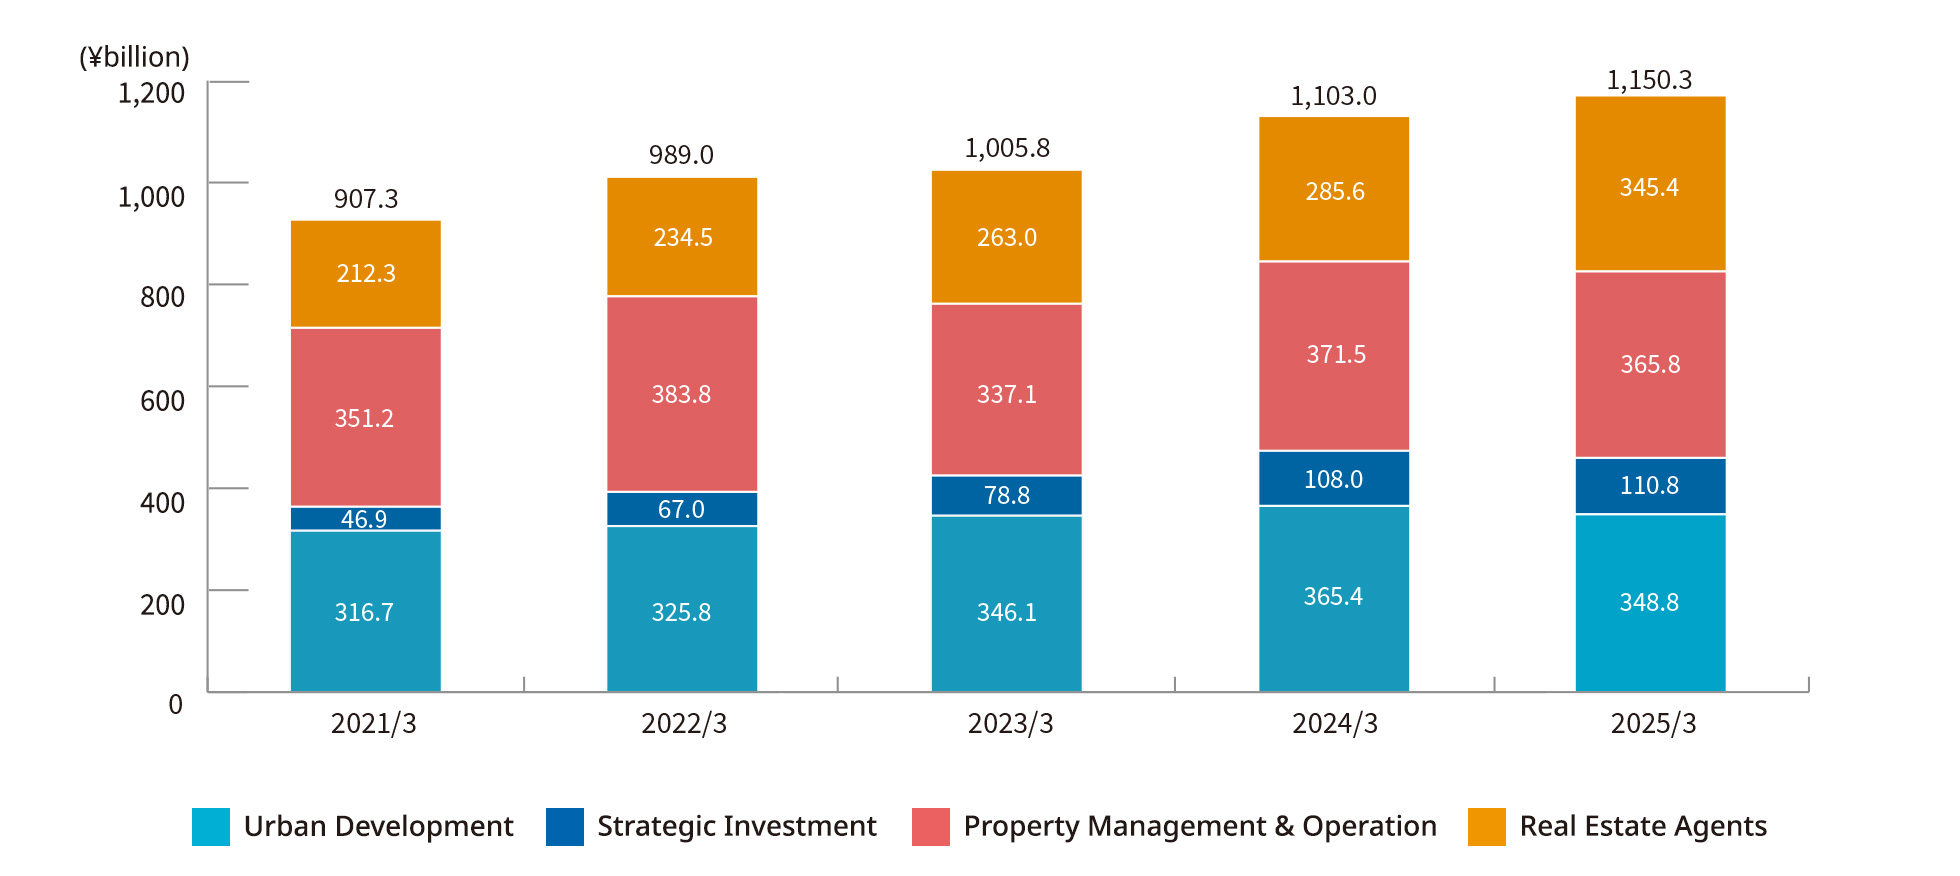
Revenue from Operations (consolidated)
You can scroll this table sideways
You can scroll this table sideways
(¥ billion)
| FY2020 | FY2021 | FY2022 | FY2023 | FY2024 | |
|---|---|---|---|---|---|
| Urban Development | 316.7 | 325.8 | 346.1 | 365.4 | 348.8 |
| Strategic Investment | 46.9 | 67.0 | 78.8 | 108.0 | 110.8 |
| Property Management & Operation | 351.2 | 383.8 | 337.1 | 371.5 | 365.8 |
| Real Estate Agents | 212.3 | 234.5 | 263.0 | 285.6 | 345.4 |
| Elimination | (19.4) | (22.0) | (19.1) | (27.4) | (20.6) |
| Total | 907.7 | 989.0 | 1,005.8 | 1,103.0 | 1,150.3 |
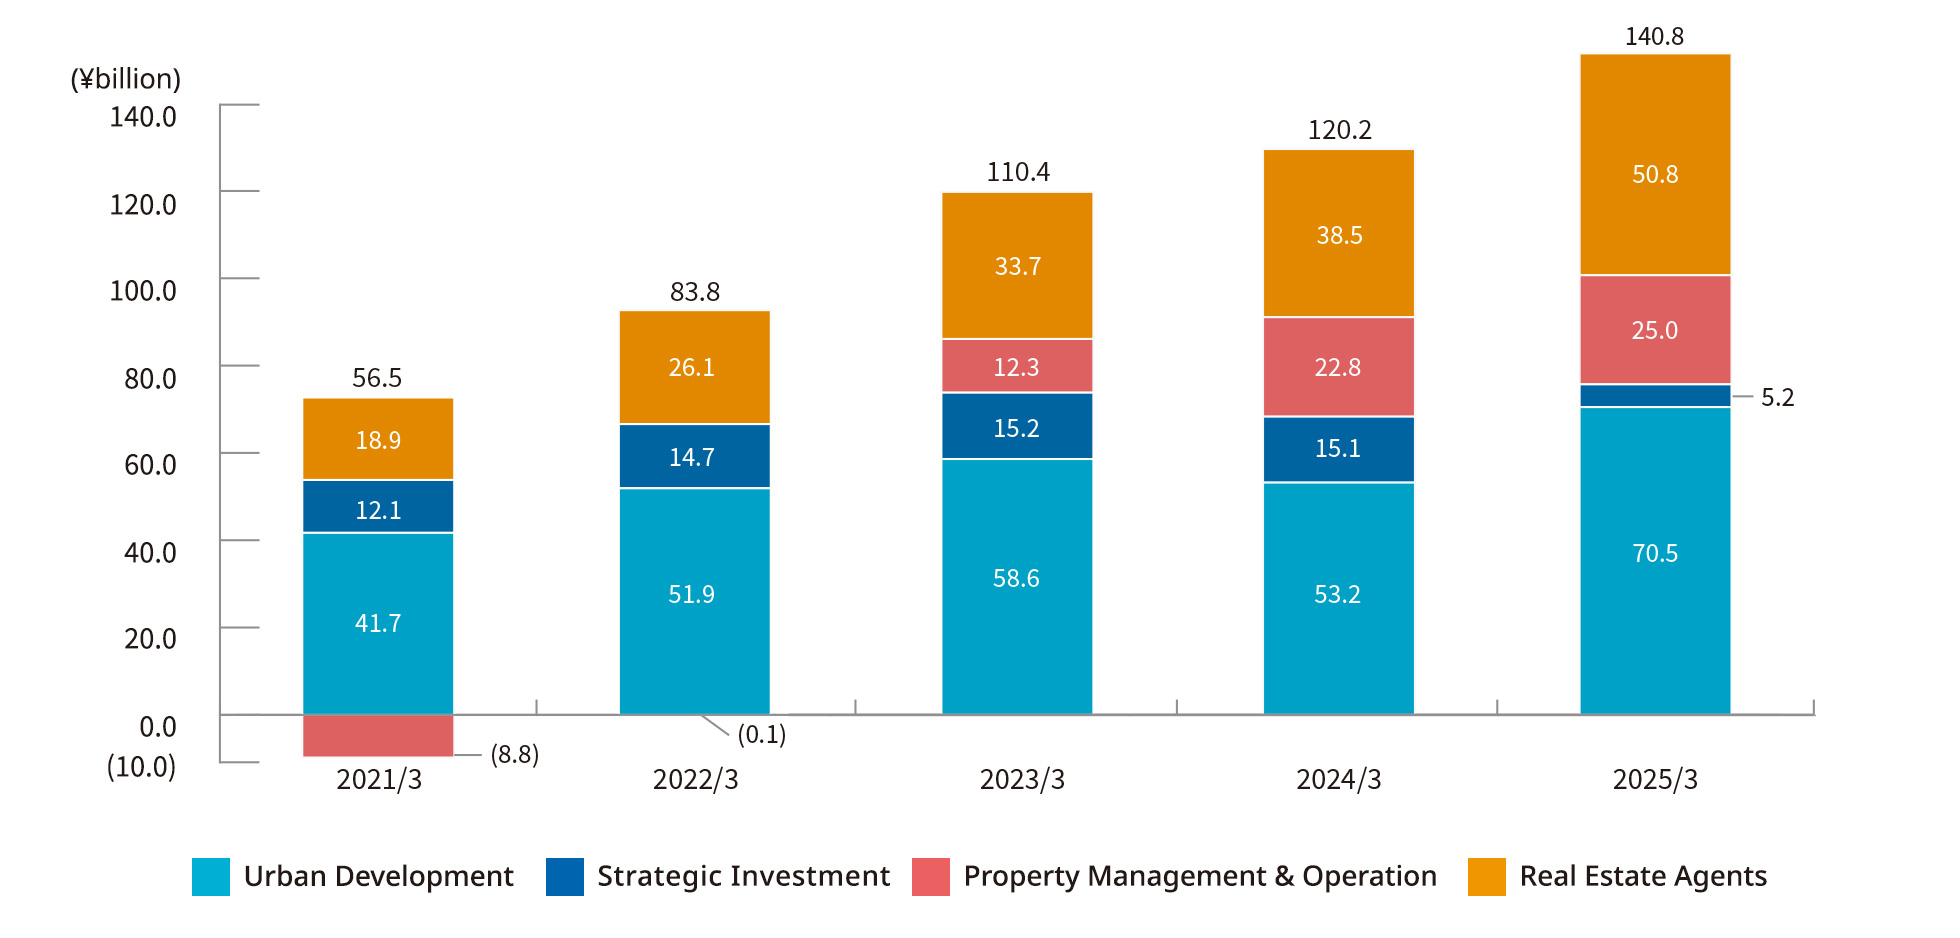
Operating profit (consolidated)
You can scroll this table sideways
You can scroll this table sideways
(¥ billion)
| FY2020 | FY2021 | FY2022 | FY2023 | FY2024 | |
|---|---|---|---|---|---|
| Urban Development | 41.7 | 51.9 | 58.6 | 53.2 | 70.5 |
| Strategic Investment | 12.1 | 14.7 | 15.2 | 15.1 | 5.2 |
| Property Management & Operation | (8.8) | (0.1) | 12.3 | 22.8 | 25.0 |
| Real Estate Agents | 18.9 | 26.1 | 33.7 | 38.5 | 50.8 |
| Elimination | (7.3) | (8.9) | (9.4) | (9.5) | (108) |
| Total | 56.5 | 83.8 | 110.4 | 120.2 | 140.8 |