|
|
 |
|
 |
|
 |
|
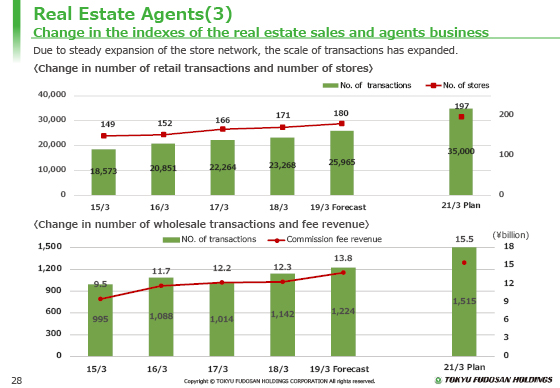
Next, the changes in performance indicators in sales agency operations are explained.
The graph in the upper section of this page shows changes in the number of stores and transactions in the Retail sector in the fiscal year ended March 31, 2015.
As this graph shows, the number of transactions increased in addition to the number of stores.
We believe our quick approach to work-style reform ahead of competitors, personnel procurement and continued store openings through brands and other strategies contributed to the increase in the number of transactions.
The graph in the lower section shows changes in the amount of transactions and commission income in the Wholesale sector.
In the Wholesale sector, we have the advantage of the ability to handle all areas and various asset types. The scale of our wholesale business has exceeded 10 billion yen on a commission income basis. The business is continuing to expand steadily toward the medium-term target of 15.5 billion yen.
We set stronger initiatives on various operational assets, including logistics facilities and hotels, as our target in the Medium-Term Management Plan. We will enhance our initiatives on those assets in the Wholesale sector.
|
|
|
