|
|
 |
Next, the advantages of the portfolio of office buildings of the Company are explained.
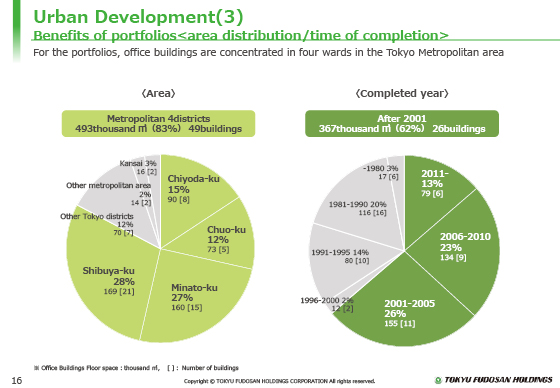
One of the advantages of the Company's portfolio is the holding of many relatively new high-spec buildings on a relatively medium scale with an area of 10 to 20 thousand square meters in Shibuya (the location of the Company's business base), Minato, Chuo and Chiyoda wards.
The graph on the left shows the area distribution. The properties in the four wards of the Tokyo metropolitan area account for 83% of the whole.
The pie chart on the right shows the entire year.
The majority are relatively new buildings completed in and after 2001. There are few properties built in and before 1980, according to the former standards for earthquake resistant design.
|
|
|
