|
|
 |
|
 |
|
 |
|
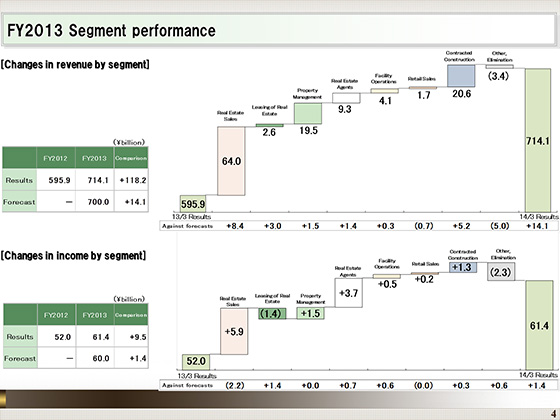
Next, I would like to explain changes in operating revenue and operating income by segment.
As the bar graph at the top shows, all the segments achieved higher revenue.
Revenue increased ¥118.2 billion from the previous fiscal year, given contributions from the Real Estate Sales segment, which posted an increase in sales of mainly condominiums, and the Property Management segment and the Contracted Construction segment, which marked higher revenue mainly from the effects of the inclusion of United Communities Co., Ltd., in the consolidated subsidiaries.
The bar graph at the bottom also shows higher income in all the segments, except for the Leasing of Real Estate segment, which incurred lost profits as a result of the asset transfer to Activia Properties Inc.
Operating income rose ¥9.5 billion year on year on the back of higher income in the Real Estate Sales segment, in the same manner as for revenue, and strong performance in the Real-Estate Agents segment that posted steady real estate sales agent business.
I will explain the performance of each segment in more detail later.
|
|
|
