|
|
 |
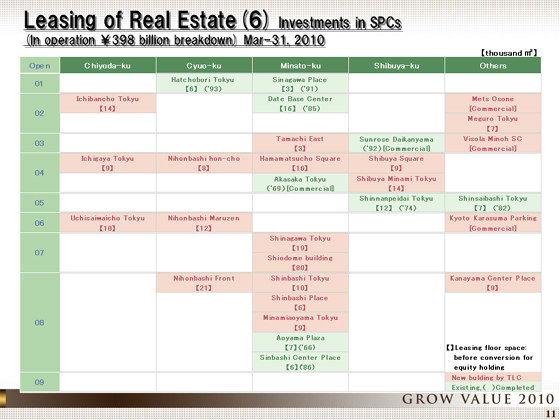
On page 11, we list the breakdown of ¥398.0 billion in assets in operation that are owned by SPCs.
Properties in pink columns represent buildings on land acquired and newly developed by the Company, while properties in green columns show the existing buildings acquired by the Company, both of which are plotted according to area and their date of opening (in their fiscal year).
As you can see, most properties are concentrated in the four central wards of Tokyo, and many of the buildings are recently completed, new office buildings.
The average NOI earnings yield is about 7%. Assuming the transaction CAP rate of 5% at the present moment, we recognize that the properties are performing well with unrealized gains.
|
|
|
