|
|
 |
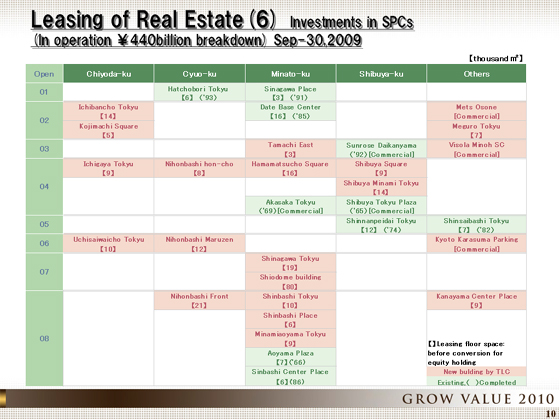
Slide 10 shows a breakdown of the ¥440 billion in operating assets held by SPCs. The pink indicates properties that we developed from scratch by sourcing land. Green represents acquisitions of existing buildings. This chart plots properties by area and by opening year.
Our properties are concentrated within the four central wards of Tokyo. As you can see, our assets are relatively young, with new office buildings. The average NOI yield of this portfolio is about 7%. If we were to hypothetically apply a cap rate of 5%, our portfolio would have a substantial latent gain, which signifies the quality of our portfolio.
|
|
|
