|
|
 |
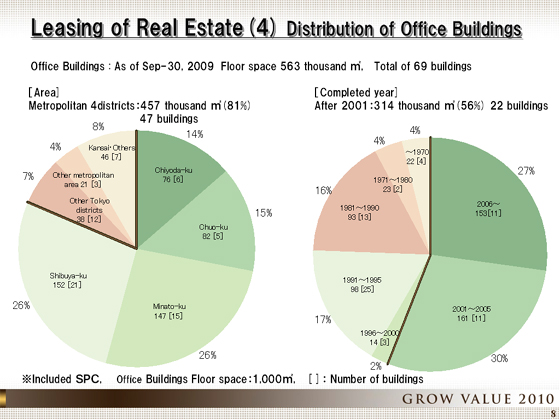
Refer to the pie graphs for the distribution of our office building portfolio. Total floor space in all of our office buildings stood at 563,000 m² at the end of September. Some 81% of this total, or 457,000 m², is located in the four central wards of Tokyo, namely Chiyoda Ward, Chuo Ward, Minato Ward and Shibuya Ward. The proportion of total office space located in central Tokyo has increased substantially, up from 70% at the end of March 2005.
This has occurred as a result of further new openings in central Tokyo and the ongoing restructuring of our assets. In terms of the year in which the buildings were completed, 56% of the buildings were completed from 2001 onwards.
We believe that the fact that such a high proportion of our building portfolio consists of new buildings and buildings located in central Tokyo means that our building portfolio is in a relatively strong position to withstand deteriorations in market conditions.
|
|
|
