|
|
 |
|
 |
|
 |
|
I would now like to explain the performance indicators in the real-estate sales agent business.
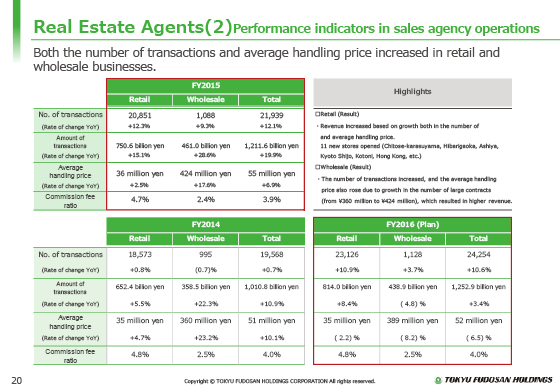
As shown in the upper left section, in the fiscal year ended March 31, 2016, both the number of transactions and the average handling price increased amid a strong retail market, and the amount of transactions rose 15% year on year.
We improved our services such as the Anshin Mediation Guarantee, and we launched 11 new stores and will be launching another 11 in fiscal year 2017.
In the wholesale division, increased numbers of transactions and contracts for large properties resulted in a rise in the average handling price from ¥360 million a year earlier to ¥424 million, and the amount of transactions increased by 28% year on year.
The total amount of transactions in retail and wholesale combined rose approximately ¥1.2 trillion, an increase of approximately 20% year on year, showing steady business growth.
As presented in the plan for the fiscal year ending March 2017, shown in the table on the bottom right, we expect that the average handling price will fall due to the contracts for large property units in the fiscal year ended March 2016, while revenue from the agency business is expected to increase thanks, in large part, to a higher number of transactions and commission rate.
|
|
|
