|
|
 |
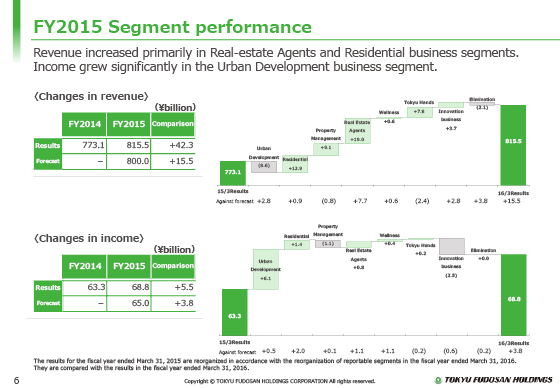
I will now explain the changes in operating revenue and operating income by segment.
As you can see in the bar graph at the top, operating revenue decreased due to a fall in the gain on sales of buildings for investors in the Urban Development business segment. However, bulk sales of land in the Residential business segment increased and agency and other operations in the Real-estate Agent business segment remained strong, and as a result, we achieved year-on-year growth of ¥42.3 billion in revenue.
In the graph at the bottom showing operating income, operating revenue on the sales of buildings for investors in the Urban Development business segment decreased, but a gain on sale increased and contributed to an increase in profit of ¥5.5 billion year on year.
I will explain the performance of each segment in more detail later on.
|
|
|
