|
|
 |
|
 |
|
 |
|
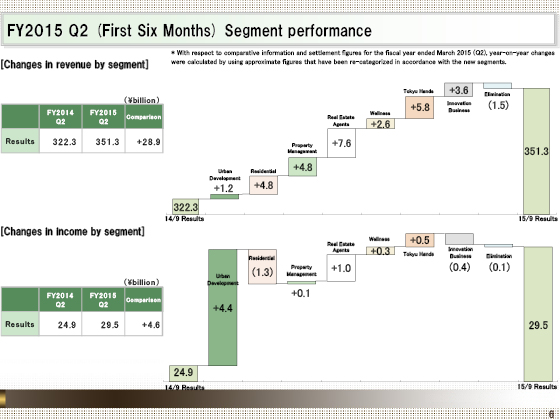
Next, I would like to explain the changes in operating revenue and operating income by segment.
As the bar graph at the top shows, operating revenue grew in all segments, but particularly in the real-estate agent business and the Tokyu Hands business. As a result, operating revenue increased ¥28.9 billion year on year.
The operating income at the bottom grew ¥4.6 billion year on year, led by the Urban Development segment, in which a gain on sale of buildings for investors, etc. increased and, as with operating revenue, sales in the real-estate agent and Tokyu Hands businesses remained strong.
I will explain the performance of each segment in greater detail later on.
The segmentation of some businesses has been changed from the fiscal year ending March 31, 2016.
The results of the fiscal year ended March 31, 2015 that were used for comparison have been modified based on these changes in segmentation.
Please check the specific changes in segmentation later in the reference at the end of the report.
|
|
|
