|
|
 |
|
 |
|
 |
|
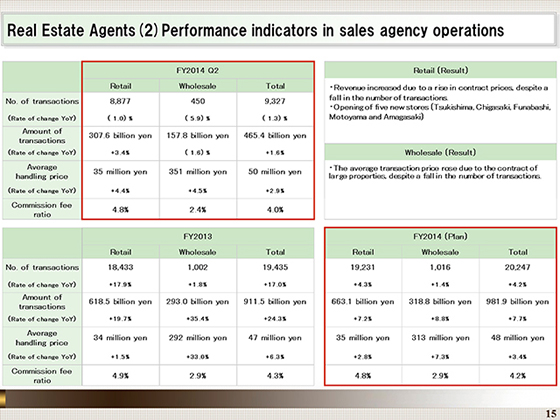
I would now like to explain the performance indicators in the real estate sales agent business.
In the first six months of the fiscal year ending March 2015, the number of transactions declined in retail sales as the market remained weak compared with the same period of the previous fiscal year due to the consumption tax hike, but the amount of transactions increased about 3% year on year as the average transaction price rose.
We continued to strive to strengthen our services by commencing new consultation services for vacant housing, among other services, and opened five new stores.
In wholesale sales, although the average handling price rose 4.5% year on year, to ¥351 million reflecting an increase in contracts for large properties, the number of transactions declined, and the amount of transactions fell 1.6% year on year.
As presented in the plan for the fiscal year ending March 2015, shown in the table on the bottom right, we expect that the number of transactions will increase year on year and the amount of transactions will also rise 7.7% year on year in both retail sales and wholesale sales.
|
|
|
