
INVESTOR RELATIONS
Segment Infomation
Segment Infomation
[Accounting standards: Japanese GAAP]
Revenue from Operations(consolidated)
You can scroll this table sideways
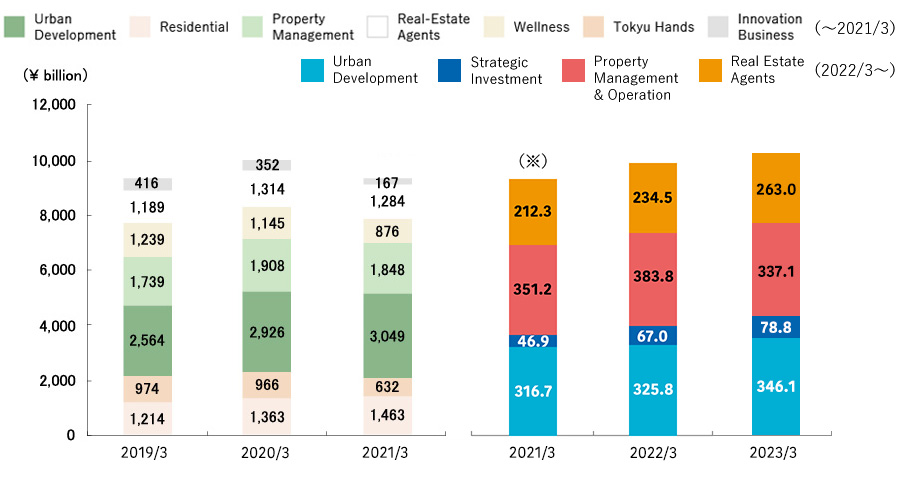
The Group has changed its reportable segment classifications from seven business segments to four business segments effective from the FY2021 (ended March 31, 2022).
The fiscal year ended March 31, 2021 have been restated in accordance with the new segment classifications.
(¥ billion)
You can scroll this table sideways
| 2019/3 | 2020/3 | 2021/3 | |
|---|---|---|---|
| Urban Development |
256.4 | 292.6 | 304.9 |
| Residential | 121.4 | 136.3 | 146.3 |
| Property Management |
173.9 | 190.8 | 184.8 |
| Real-Estate Agents |
118.9 | 131.4 | 128.4 |
| Wellness | 123.9 | 114.5 | 87.6 |
| Tokyu Hands | 97.4 | 96.6 | 63.2 |
| Innovation Business |
41.6 | 35.2 | 16.7 |
| Elimination | (31.6) | (34.3) | (24.2) |
| Total | 901.9 | 963.2 | 907.7 |
You can scroll this table sideways
| 2021/3※ | 2022/3 | 2023/3 | |
|---|---|---|---|
| Urban Development | 316.7 | 325.8 | 346.1 |
| Strategic Investment | 46.9 | 67.0 | 78.8 |
| Property Management & Operation | 351.2 | 383.8 | 337.1 |
| Real Estate Agents | 212.3 | 234.5 | 263.0 |
| Elimination | (19.4) | (22.0) | (19.1) |
| Total | 907.7 | 989.0 | 1,005.8 |
Operating profit (consolidated)
You can scroll this table sideways
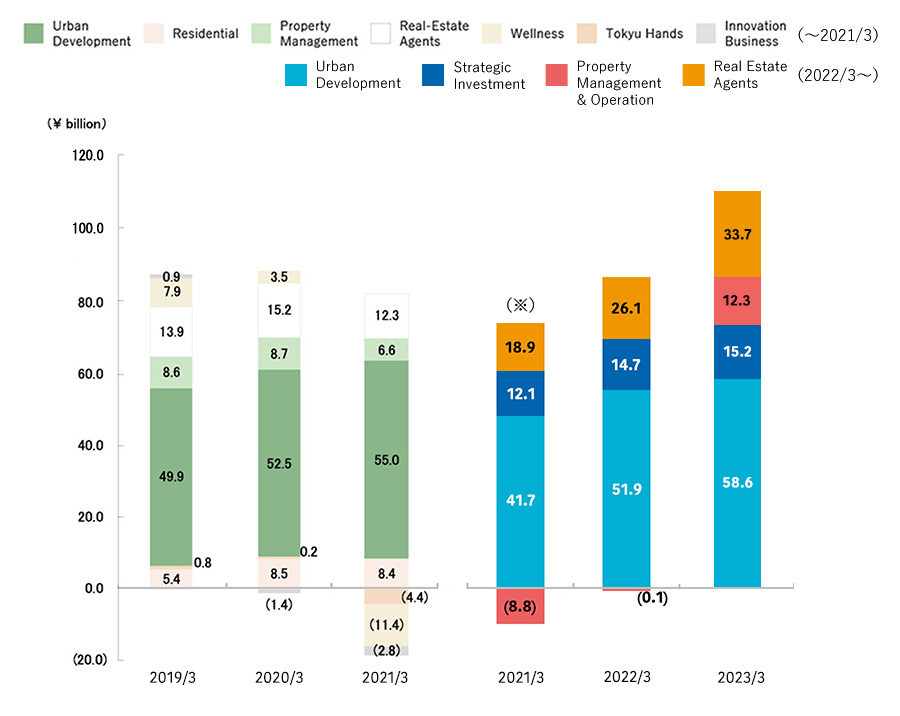
The Group has changed its reportable segment classifications from seven business segments to four business segments effective from the FY2021 (ended March 31, 2022).
The fiscal year ended March 31, 2021 have been restated in accordance with the new segment classifications.
(¥ billion)
You can scroll this table sideways
| 2019/3 | 2020/3 | 2021/3 | |
|---|---|---|---|
| Urban Development | 49.9 | 52.5 | 55.0 |
| Residential | 5.4 | 8.5 | 8.4 |
| Property Management | 8.6 | 8.7 | 6.6 |
| Real-Estate Agents | 13.9 | 15.2 | 12.3 |
| Wellness | 7.9 | 3.5 | (11.4) |
| Tokyu Hands | 0.8 | 0.2 | (4.4) |
| Innovation Business |
0.9 | (1.4) | (2.8) |
| Elimination | (7.1) | (8.1) | (7.3) |
| Total | 80.2 | 79.3 | 56.5 |
You can scroll this table sideways
| 2021/3※ | 2022/3 | 2023/3 | |
|---|---|---|---|
| Urban Development | 41.7 | 51.9 | 58.6 |
| Strategic Investment | 12.1 | 14.7 | 15.2 |
| Property Management & Operation | (8.8) | (0.1) | 12.3 |
| Real Estate Agents | 18.9 | 26.1 | 33.7 |
| Elimination | (7.3) | (8.9) | (9.4) |
| Total | 56.5 | 83.8 | 110.4 |